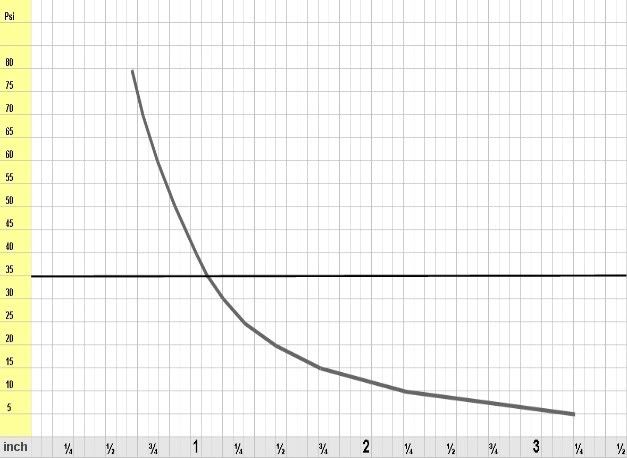
Was playing around with a small compressor in the garage a few weeks ago. One thing led to another and I ended up measuring tire deflection on the passenger front in 5lb increments from 80psi down to 5psi. The result is the graph below. One thing I wanted to know is what the curve looked like below 35psi where the load tables end for LT tires. I originally drew the lines in the charts, above, straight down to 20psi to make the relationships more obvious at a glance. They are a little too straight as it is, but continuing them straight past the end of the load tables needed to be fixed, and now it is.
It's interesting to me how 35psi is just about the spot where the curve below really starts to bend. I'm assuming it's no coincidence that's where the LT load tables end.