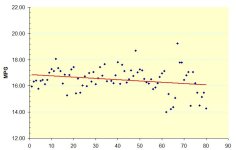
For the sake of statistical ease, lets pop out those outliers. Bad math or weird circumstances that cannot be a. repeated or b. nailed down can cause them.
Once we throw out the outliers, you have an obvious trend. Your slow, gradual down curve could be caused be a million little things that occur over time, that alone may not matter, but in combination add up to the percentage drop you are seeing.
Older tires, that have off inflation? Dirty air filter? Plugs?
I am obviously spitballing. You do not appear to have an instant, dramatic change (outliers disregarded)... and therefore it is really hard to speculate.
Edit: On second thought. Your mid graph highs are clearly outliers, but I am now not so sure about your end graph low scores.. You continue to see your average highs, but your lows are popping down.
If you get me the actual data. An excel or comma delimited file; I can run some numbers and see what is up. Also, can you get any more data points after your last set?
What I would like to see is some more data Further Along....... to see if those are outliers or in fact a new trend.