EasyAndy's MPG Analysis (winter gas redux)

mug_im_an_engineer.jpg
 

Attachments

  • mug_im_an_engineer.jpg
    mug_im_an_engineer.jpg
    11.1 KB · Views: 179
no biggie, just its crap up here since most of our gas comes from Canada so we get screwed.

unlike yourself where the gas is made and sold in the same local area, so its going to be cheaper due to economics of distance from a refinery.

Yes but in the oil producing states, drops like this in gas prices typically equates to massive losses of good paying jobs. My home town completely crashed when opec flooded the market back in the 80's, so people are on edge about it. Lot's of jobs lost already.
 
Sure. I did lift and tires last feb. I haven't filled up the 4Runner since November 19th. Been driving my Tahoe a lot.


One last thing - Can you guys also plot your mileage? I know it gives the beginning and ending mileage and I "assume" (coughcough) that the width of the bars in your charts somehow tells me the frequency of the fill ups (narrow = more fill ups in period of time) but that will be important to seeing the true trend. [MENTION=108420]EasyAndy[/MENTION]'s graph was "easy" (lol) because he drives almost the exact same number of miles a week. His mileage graph was almost linear and plotting the mpg against it really showed his true trend. Just curious is all.
 
One last thing - Can you guys also plot your mileage? I know it gives the beginning and ending mileage and I "assume" (coughcough) that the width of the bars in your charts somehow tells me the frequency of the fill ups (narrow = more fill ups in period of time) but that will be important to seeing the true trend. [MENTION=108420]EasyAndy[/MENTION]'s graph was "easy" (lol) because he drives almost the exact same number of miles a week. His mileage graph was almost linear and plotting the mpg against it really showed his true trend. Just curious is all.

The program can't display that data, but I dumped the CSV for it and it's in the zip. Maybe you can add in a poly for the Smiles Per Mile..
 

Attachments

The program can't display that data, but I dumped the CSV for it and it's in the zip. Maybe you can add in a poly for the Smiles Per Mile..

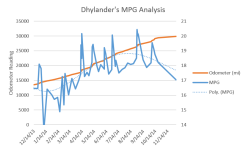
Here you go [MENTION=94375]dhylander[/MENTION]! Looks just like [MENTION=108420]EasyAndy[/MENTION]'s graph. I took only the last year's data and I put the poly 4th order trend in there and you can easily see the difference between summer and winter. Yours is not quite as big a difference but you can definitely see it. You will probably drop a bit below 17 before you bounce back in the summer. Looks quite a bit different than your bar graph.

Basically I just wanted to show (and prove to myself with real world data besides my own) that there is a marked (7-20% average depending) between summer and winter gas.
Here is the graph:
 

Attachments

  • 4Runner MPG1.png
    4Runner MPG1.png
    56.3 KB · Views: 249
Last edited:
You need to document three basic things:

1. Odometer reading at every fill up

2. Gallons purchased at every fill up

3. Date of fill up


I just use my notepad app on the phone and enter it later into Excel. There are several specific app you can use that will do the same but I like manipulating my own data. You are correct now is the perfect time to do this.


Cool deal
 
The program can't display that data, but I dumped the CSV for it and it's in the zip. Maybe you can add in a poly for the Smiles Per Mile..

[MENTION=94375]dhylander[/MENTION] Hope you don't mind, but I poked around in your data. Not that 1E is wrong, but I made some different assumptions: gas is either summer or winter (a rectangular function: summer, winter, summer, etc.; not a polynomial) and that winter gas begins in mid-September and ends in mid-May (as AAA says it did in Denver). I also weighted your data for miles between fill-ups. Here's what I found:

Effect of summer vs. winter gas: 0.91 MPG

However, you drive fewer miles per day in my designated winter months. Perhaps this means you do more city driving, I don't know. So I looked at the combined effects of summer/winter gas and the days between fill-ups (also weighted by miles). And then this is what I found:

Effect of summer vs. winter gas: 0.75 MPG
Effect of 1 week vs. 2 week fill-up: 0.49 drop in MPG when fill-up is two weeks.
 
Wow you f-n engineers are on it man ,I'm being serious this is cool shit to know ! I always thought it was mid Oct . Sept here is still cooking low 100 to high 90s so I never really noticed till usually around Nov . I learn stuff everyday but this good stuff ! Thanks
 
[MENTION=94375]dhylander[/MENTION] Hope you don't mind, but I poked around in your data. Not that 1E is wrong, but I made some different assumptions: gas is either summer or winter (a rectangular function: summer, winter, summer, etc.; not a polynomial) and that winter gas begins in mid-September and ends in mid-May (as AAA says it did in Denver). I also weighted your data for miles between fill-ups. Here's what I found:

Effect of summer vs. winter gas: 0.91 MPG

However, you drive fewer miles per day in my designated winter months. Perhaps this means you do more city driving, I don't know. So I looked at the combined effects of summer/winter gas and the days between fill-ups (also weighted by miles). And then this is what I found:

Effect of summer vs. winter gas: 0.75 MPG
Effect of 1 week vs. 2 week fill-up: 0.49 drop in MPG when fill-up is two weeks.

I simply used the polynomial trend to smooth the curves not due to strict function.

Now let's get into the more esoteric areas for a minute.

You maybe need to consider a few more variables before making a strict date assumption and the curves sort of prove this:

Gas Mixing
Basic assumptions:
Let's say mid September the stations get their first supply of winter gas. Well, the tanks still have some summer gas in them so the winter gas and summer gas are mixed for a period of time! This means a hard date is tough to pick. Same for your gas tank. You have a half a tank of summer gas and fill up with winter gas so you are running a blend for a time. Now to compound this problem (and this happens year long) you have the Ethanol blending. You could fill up with UP TO 10% Ethanol, depending on what the refinery blended. It could be 2% or 7% or 10% and that will have to mix with whatever you have in the tank!

That's why I wanted to look at a year long trend. Not linear but something that would approximate the actual curve, hence polynomial.
If you look at the beginning of the curves you will see lower mpg than the end of the curve. I think that is due to the fact that they have been running winter gas for that whole season instead of just Oct-December. Who really knows but it's fun to try to figure it out.


Wow you f-n engineers are on it man ,I'm being serious this is cool shit to know ! I always thought it was mid Oct . Sept here is still cooking low 100 to high 90s so I never really noticed till usually around Nov . I learn stuff everyday but this good stuff ! Thanks

No problem man. I try to look a bit deeper than the average bear.
 
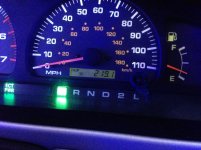
Mostly around town driving with ECT. always on,Sorry i have no chart. :lalala::biggrin2:
 

Attachments

  • IMG_0228.jpg
    IMG_0228.jpg
    134.4 KB · Views: 178
I simply used the polynomial trend to smooth the curves not due to strict function.

Now let's get into the more esoteric areas for a minute.

You maybe need to consider a few more variables before making a strict date assumption and the curves sort of prove this:

Gas Mixing
Basic assumptions:
Let's say mid September the stations get their first supply of winter gas. Well, the tanks still have some summer gas in them so the winter gas and summer gas are mixed for a period of time! This means a hard date is tough to pick. Same for your gas tank. You have a half a tank of summer gas and fill up with winter gas so you are running a blend for a time. Now to compound this problem (and this happens year long) you have the Ethanol blending. You could fill up with UP TO 10% Ethanol, depending on what the refinery blended. It could be 2% or 7% or 10% and that will have to mix with whatever you have in the tank!

That's why I wanted to look at a year long trend. Not linear but something that would approximate the actual curve, hence polynomial.
If you look at the beginning of the curves you will see lower mpg than the end of the curve. I think that is due to the fact that they have been running winter gas for that whole season instead of just Oct-December. Who really knows but it's fun to try to figure it out.

Agreed! It's fun to try to figure it out.

My basic assumption was SOP, not strict. But I think it's a closer approximation than a curve that takes months to approach maximum. Here are a few items from the The Association for Convenience and Fuel Retailing (NACS) about the fuel retailing industry from their 2014 Retailing Fuels Report:

"The end point in a series of handoffs to prepare for summer-blend fuel is the date at which retailers must sell the fuel. In most areas of
the country that require summer-blend fuels, retailers have until June 1 to switch to selling summer-grade gas." ... "The May 1 deadline for terminals is considered one of the biggest factors in the seasonal price increases. Terminals have to fully purge their systems of winter-blend fuels and be near empty to make the transition and be in compliance [with EPA regulations]. Those out of compliance face stiff penalties, so most terminal operators would rather be out of inventory than out of compliance."

"Unlike in the spring, the change to winter-blend fuel is not required. However, because winter-blend fuel costs less, retailers obviously want to sell the cheaper fuel so they can be as price competitive as possible. Not all retailers begin selling this fuel on September 15; most wait to make the switch until their inventories are low and need a new shipment. A retailer’s volume will dictate how often a station gets deliveries, with some stores getting multiple deliveries per day and others getting one or two deliveries per week."

So ... you won't be finding much winter gas in June, and you won't be finding much summer gas in October, except for whatever residual is remaining in your tank.

By the way, this report can be found at:
http://www.nacsonline.com/YourBusiness/FuelsReports/GasPrices_2014/Documents/2014NACSFuelsReport_full.pdf

As for 2% ethanol vs. 7% ethanol vs. 10% ethanol, I have no clue. No clue whatsoever.

Oh. And California's summer gas deadline is April 1, not June 1.
 
You need to document three basic things:
1. Odometer reading at every fill up


correct me if I'm wrong but this only works on stock size tires. what I've been doing is resetting the trip ODO and then adding in the percent in tire size

Example:

odo reads 230
original tires were 235/75/15 new are 265/75/16 so the difference is about 9.6%
actual mileage is 252.8
 
correct me if I'm wrong but this only works on stock size tires. what I've been doing is resetting the trip ODO and then adding in the percent in tire size

Example:

odo reads 230
original tires were 235/75/15 new are 265/75/16 so the difference is about 9.6%
actual mileage is 252.8

Correct. Most that go to a larger tire aren't much concerned with a few mpg's.
 
Here you go [MENTION=94375]dhylander[/MENTION]! Looks just like [MENTION=108420]EasyAndy[/MENTION]'s graph. I took only the last year's data and I put the poly 4th order trend in there and you can easily see the difference between summer and winter. Yours is not quite as big a difference but you can definitely see it. You will probably drop a bit below 17 before you bounce back in the summer. Looks quite a bit different than your bar graph.

Basically I just wanted to show (and prove to myself with real world data besides my own) that there is a marked (7-20% average depending) between summer and winter gas.
Here is the graph:

[MENTION=66316]1engineer[/MENTION], I thought they would be similar and I think the difference in my data would reflect a larger offset if I was on the same tires for the entire year. April 1st I took off the LE wheels and 275/55/20 Mich MS2's and put 265/70/17 AT3's on. I figure I lost about .75 mpg from that change.
 
[MENTION=94375]dhylander[/MENTION] Hope you don't mind, but I poked around in your data. Not that 1E is wrong, but I made some different assumptions: gas is either summer or winter (a rectangular function: summer, winter, summer, etc.; not a polynomial) and that winter gas begins in mid-September and ends in mid-May (as AAA says it did in Denver). I also weighted your data for miles between fill-ups. Here's what I found:

Effect of summer vs. winter gas: 0.91 MPG

However, you drive fewer miles per day in my designated winter months. Perhaps this means you do more city driving, I don't know. So I looked at the combined effects of summer/winter gas and the days between fill-ups (also weighted by miles). And then this is what I found:

Effect of summer vs. winter gas: 0.75 MPG
Effect of 1 week vs. 2 week fill-up: 0.49 drop in MPG when fill-up is two weeks.

[MENTION=101428]Bilbo[/MENTION], I don't mind at all and your assumption is correct. I drive from April up until mid October a couple of times a month to our lake house in VT. Although I do wheel some while up there which brings that down. I did however change tires beginning of April and going to the 265/70/17 AT3's from 275/55/20 Mich MS2's hit me about .75 mpg as best I can figure. Not really enough data from earlier on with the Michelin's installed to get a real number.
 

Members online

Forum statistics

Threads
278,316
Messages
3,554,110
Members
248,016
Latest member
Advally Service

Trending content

Back
Top